


Each quarter CommSec attempts to find out which state or territory is Australia’s economic leader. Now in its 16th year, the report also includes a section comparing annual growth rates for the eight key indicators across the states and territories as well as Australia as a whole, enabling comparisons in terms of economic momentum.
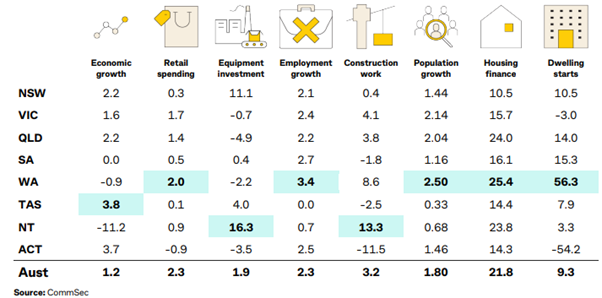
- Economic growth
- Retail spending
- Equipment investment
- Unemployment
- Construction work done.
- Population growth
- Housing finance
- Dwelling commencements.
Just as the Reserve Bank uses long-term averages to determine the level of “normal” interest rates; CommSec have done the same with the economic indicators. For each state and territory, latest readings for the key indicators were compared with decade averages – that is, against the “normal” performance.
Each quarter CommSec attempts to find out which state or territory is Australia’s economic leader. The report also includes a section comparing annual growth rates for the eight key indicators across the states and territories as well as Australia as a whole, enabling comparisons in terms of economic momentum.
To read the full April 2025 report click here
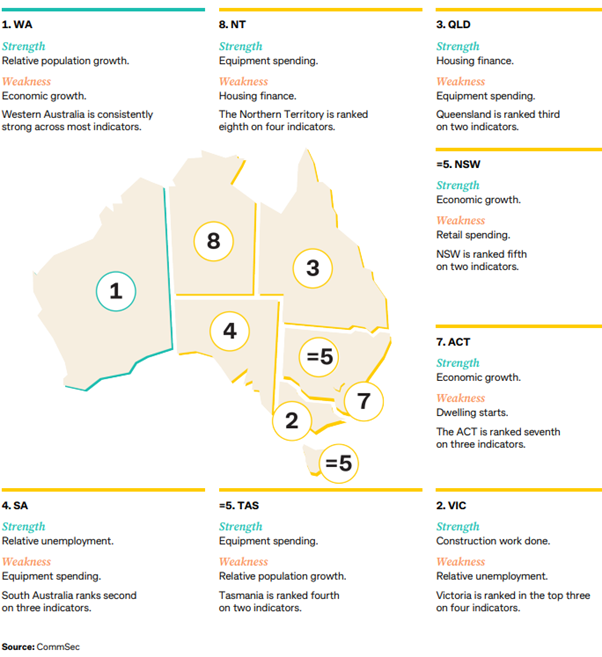
WA makes it a hat-trick as Australia’s top performing economy
For the third quarter in a row, Western Australia topped the economic leaderboard in the latest CommSec State of the States report, while Victoria leapfrogged both Queensland and South Australia to move into second place.
"Western Australia performed strongly across multiple economic indicators, as ‘The West’s’ strong relative population growth has boosted labour and housing markets, encouraging consumers to spend," Chief CommSec Economist Ryan Felsman said.
“Overall, the economic performance of Australia’s states and territories is being supported by a strong job market, robust government spending and solid population growth at a time of higher cost-of-living pressures.
“Economic growth has slowed however, as consumer spending remains subdued due to still-elevated borrowing costs. As we look ahead, an expected reduction in interest rates could boost economic sentiment in the mortgage-sensitive states of New South Wales and Victoria, while the interplay between interest rate cuts, federal election outcomes, and global trade dynamics will be crucial in shaping the economic outlook."
In the April 2025 edition of the State of the States:
Western Australia ranked first on five economic indicators: retail spending, relative unemployment, relative population growth, housing finance and dwelling starts.
Victoria moved up from fourth to second place, leading on construction work done and ranking second on retail spending and third on relative population growth. The state however finished bottom of the table on relative unemployment.
Queensland slipped one spot to third place, performing well across the housing finance, dwelling starts and retail spending indicators, despite weak equipment investment.
South Australia dropped from equal second to fourth position on the leaderboard, ranking second on three indicators but held-back by lower rankings on economic growth, equipment investment and relative population growth.
Tasmania is steady in joint fifth spot — leading on equipment spending. NSW moves up to equal fifth from sixth position and now ranks first on economic growth, while the ACT remains seventh — in that position on three indicators.
The Northern Territory stays in eighth place, however the decade-average method of assessing economic performance disadvantages the Top End given significant LNG construction over 2012–18 inflated a range of economic indicators.
Growth Leaders
The State of the States report assesses economic performance by looking at the most recent results—such as retail trade or construction—and compares that with the ‘normal experience’. And by ‘normal experience’, we define this as the decade average.
A resident of the state or territory can therefore assess whether they are experiencing relatively better economic times. Comparing states or territories on the same criteria determines which state or territory is performing the best on a certain indicator.
In addition to relative economic performance, some are also interested in economic momentum. That is, annual changes to the key indicators. A state or territory may have been under-performing, but if annual growth is strengthening, then this suggests that performance has scope to improve.
As noted above, annual growth rates are a better tool of measurement of economic performance for the Northern Territory as the small, open economy is buffeted by big projects (such as LNG construction over 2012–18 period which inflated decade averages).
Copyright © 2025 Coastline Private Wealth, All rights reserved.
Our mailing address is:
PO Box 2082
Churchlands WA 6018


